What's happening in Salford?
Regular readers will know that one of the key drivers behind my team goal model (which ultimately backs up a lot of the individual player data too) is based on shot totals, split between those inside and outside the box. I like shots on target too, of course, but the reason I have opted for total shots in the model is for fear that over a short period, shots on target can be a bit misleading for individual players as, just as we wouldn't expect a player to score every time he hits the target, we equally wouldn't expect him to actually hit the target every time either.
With that in mind, I want to draw your attention to some interesting shot data from this and last year and open up the floor to suggestions as to (a) what is going on and (b) how we should deal with it next year. You'll notice that a lot of the posts for these remaining few weeks are going to be a bit more 'blue sky' than normal, mainly because there's only so many times you can write up the same lineup lessons are suggest that Michu is due for regression.
To start then, let's look at some likely familiar charts from prior year, first showing the strong relationship between created chances and shots inside the box and then between shots inside the box and goals:
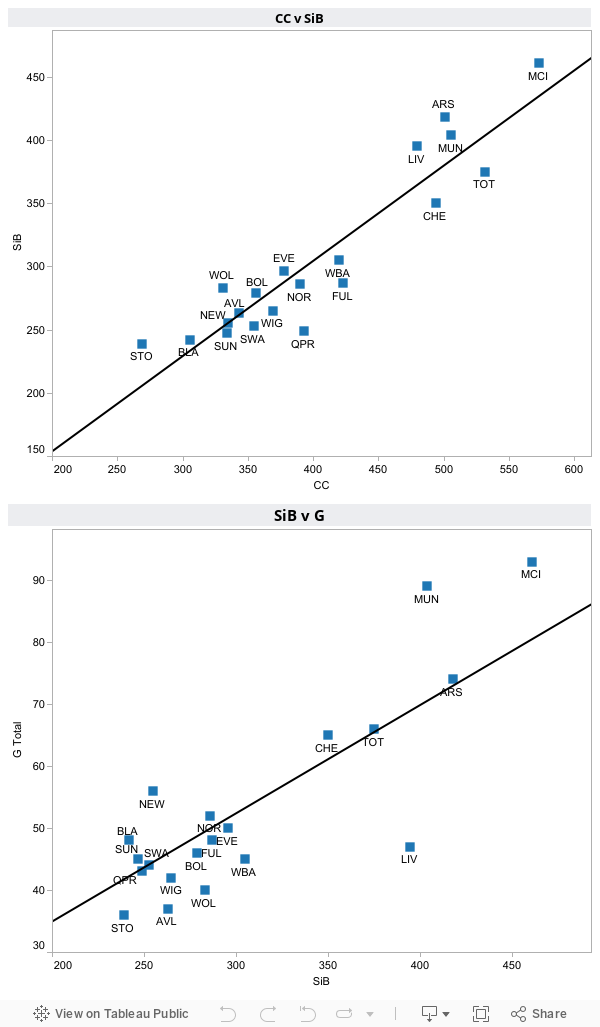
The first chart actually shows a slightly stronger correlation than expected as I thought it was reasonable for teams to rack up 'created chances' without necessarily registering a good shot on goal. Anyway, that strength of relationship suggests created chances should probably feature more heavily in the next model as a way of normalizing SiB. The second chart plots SiB against goals and shows a slightly weaker relationship that I had in mind but an r-squared of 0.72 suggests there's enough here to still rely on. The variance between expected and actual goals per this trend line were as below:
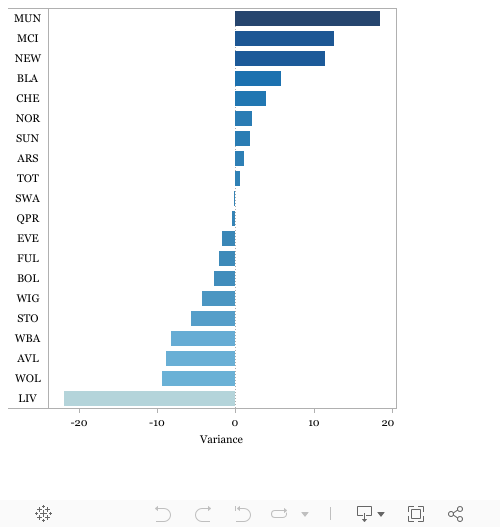
The relationship is far from concrete but generally it looks like the better teams were out shooting the expected goals while the poorer teams struggled to meet expectations (Blackburn and to a degree Liverpool were the key exceptions there. In short though, there's a decent relationship here with a couple of exceptions to keep in mind. Let's move onto this year then:
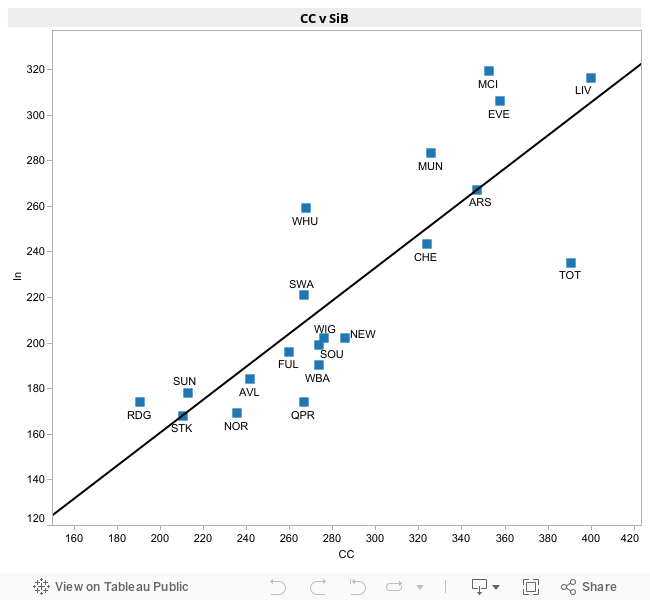
So far, so good as once again we see a strong relationship between chances created and total goals. This again suggests that the better teams who enjoy good possession in dangerous areas and/or threaten from deep balls into the box are getting more SiB and thus goals. The tricky point comes with the next chart though:
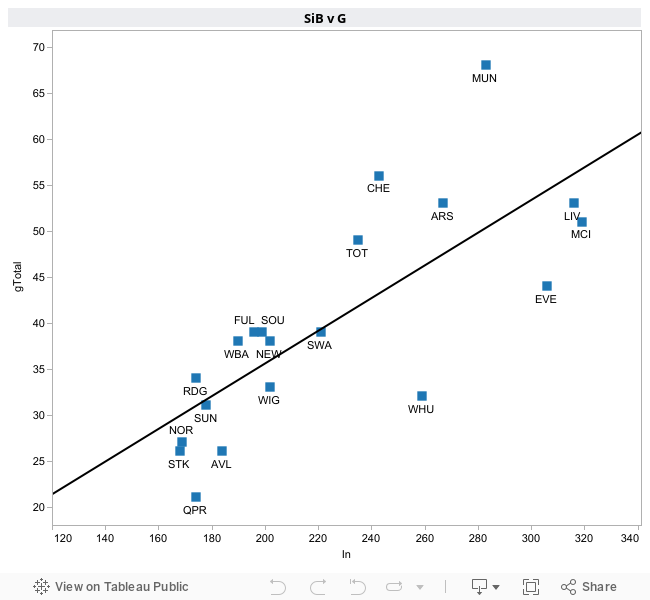
What on earth is happening with Man Utd here (the title of this post was a little dig at United's location in the North West for those outside of the UK)? Again, let's look at the variance from the line of best fit:
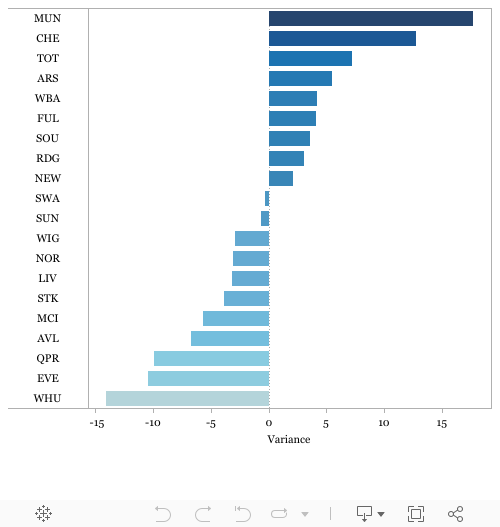
Once again United are the largest outlier and the only team who have really shown any consistency to over or under perform the SiB forecast goals over the two seasons (Villa's underperformance looks like the next closest match).
This is the point where the analysis ends and the speculation begins. We can all think of subjective reasons why this is the case for United, but are any of them backed up by stats:
- They have the best forwards, who are the most clinical and thus convert equally promising shots as other teams but at a higher rate
- They create better chances than other teams which are thus easier to convert
- They've simply enjoyed a couple of seasons where they've out scored their underlying stats and thus could regress
- Something else
With almost two full seasons of data I think we're at a point where it's unlikely that United are simply getting lucky but I haven't been able to locate anything in the data to concretely prove, and the predict what in their game makes them so much more efficient with their chances. Once again, I throw the question out to the readers to see what we can come up with.

Category Article Basketball
Popular Posts
-
.png) Response ID ANON-KMPX-Z9JK-8 Submitted on 2012-12-04 11:05:12.725334 1 What is your name? Name: Martin Porter 2 What is your e...
Response ID ANON-KMPX-Z9JK-8 Submitted on 2012-12-04 11:05:12.725334 1 What is your name? Name: Martin Porter 2 What is your e... -
 from left to right: #7 - Luca Cadalora Kenny Roberts #1 - Wayne Rainey Foto: itsawheelthing.tumblr.com
 -
 A first for me, I turned up on Saturday afternoon to the first race of the Imperial Winter Series as a spectator and to show a bit of sup...
 -
 Lay-up is one of the easiest taken in the experience of golf ball. The purpose that it is known as a easy taken in the experience is becaus...
 -
 Lat week's publication of the Mayor of London's new Vision for Cycling in London has got to be welcome. The foreward (which has a...
 -
Clean Sheet Rankings Powered by Tableau Attacking Rankings Powered by Tableau Individual Rankings On a recen...
-
 As chairmen up and down the country succumb to peer pressure and begin sacking their managers, the Managerial Merry-Go-Round ( MMGR ) step...
 -
Last month, believing the plans for CSH9 to be out for consultation I submitted my observations. I have today had a response from the Hea...

